Machine Learning & Signals Learning
18 Computer Vision Metrics
Notation Throughout this chapter, an input image \(\bX \in \mathbb {R}^{H\times W\times C_{\text {in}}}\) has spatial dimensions:
-
• \(H\) (height, in pixels) and
-
• \(W\) (width, in pixels), with
-
• \(C_{\text {in}}\in \{1,3\}\) channels (grayscale or RGB).
\(C\) denotes the number of target classes (excluding the background class \(0\) when present).
The chapter covers three computer-vision tasks:
-
• Section 18.2 (Image Classification): assign a single class label to the whole image.
-
• Section 18.3 (Image Segmentation): assign a class label to every pixel.
-
• Section 18.4 (Object Detection): locate and classify a variable number of objects with bounding boxes.
All three assume a class list fixed at training time. The open-set alternative, where an image is mapped to an embedding instead of a label, is the subject of the next chapter (Ch. 19).
18.1 Benchmark datasets
Throughout this chapter, metric conventions are tied to the public benchmarks that introduced them. The three datasets below cover detection, instance/panoptic segmentation, and urban-scene semantic segmentation; ImageNet, used in classification, is covered separately in Sec. 17.2.3.
Pascal VOC The PASCAL Visual Object Classes challenge ran from 2005 to 2012 and was the first widely-adopted detection/segmentation benchmark. The standard VOC2007 / VOC2012 splits contain \(\sim 11{,}000\) images annotated with \(20\) object classes (person, vehicles, animals, indoor objects) plus a background class. VOC introduced two conventions that this chapter inherits: the lenient IoU threshold \(\tau =0.5\) for box matching (Sec. 18.4.1) and 11-point interpolated AP for the pre-2010 editions, replaced by all-point interpolation from 2010 onward. VOC numbers are not directly comparable to COCO numbers because the threshold and interpolation conventions differ.
COCO Common Objects in Context (Lin et al., 2014) is the de-facto modern benchmark for detection, instance segmentation and panoptic segmentation. It contains \(\sim 330{,}000\) images with \(80\) “thing” classes (animals, vehicles, people, household objects) for detection / instance segmentation and a further \(91\) “stuff” classes (sky, road, grass) used by the panoptic split. COCO introduced the stricter mAP@[.5:.95] convention (averaging over ten IoU thresholds, Eq. 18.24), the \(\text {AP}_{\text {small/medium/large}}\) size breakdown that exposes the small-object weakness of IoU, and the mask-AP variant that reuses the detection recipe with mask IoU. Most pretrained detection/segmentation checkpoints in this chapter are trained on COCO.
Cityscapes Cityscapes (Cordts et al., 2016) is the standard semantic-segmentation benchmark for urban driving: \(5{,}000\) images with fine pixel-level annotations and a further \(\sim 20{,}000\) with coarse annotations, drawn from 50 European cities, evaluated on \(19\) classes (road, sidewalk, car, pedestrian, sign, \(\ldots \)) plus a void / ignore label for ambiguous or out-of-vocabulary pixels. The void label is the convention to remember: it must be excluded from both numerator and denominator of every metric, otherwise mIoU is silently inflated.
18.2 Image Classification
Image classification is the canonical computer-vision task. The model \(f_\theta (\bX )\) returns a \(C\)-length probabilistic vector on the simplex \(\Delta ^{C-1}\) (Sec. 16.3); the prediction is \(\widehat {y}=\argmax _c [f_\theta (\bX )]\).
Two sub-flavors are worth distinguishing:
-
• Single-label (multi-class) classification: exactly one of \(C\) classes per image. The output layer is a softmax (Sec. 16.3) of size \(C\) and the loss is categorical cross-entropy. This is the focus of the present section.
-
• Multi-label classification: any subset of \(C\) tags per image (e.g. scene attributes, chest-X-ray findings). The softmax is replaced by \(C\) independent sigmoids and the loss is the sum of binary cross-entropies, one per class. The architectural pattern is otherwise identical.
18.2.1 Performance metrics
Classification reuses the binary/multi-class machinery of Chapter 12: the confusion matrix and everything derived from it. The image-level specifics are top-\(n\) accuracy/error (Sec. 18.2.1) and the class-averaged metrics introduced below.
Top-\(n\) accuracy and error
A probabilistic multi-class classifier outputs a vector of class probabilities \(\hat {\bp }_i=(\hat {p}_{i,1},\ldots ,\hat {p}_{i,C})\). Ordinary accuracy uses only the top-1 prediction \(\arg \max _c \hat {p}_{i,c}\). With many classes, or with semantically similar classes (e.g. ImageNet has 1000 classes including several breeds of dog), the top-1 prediction is often a near-miss while the true class still appears among the most probable few. Allowing the classifier to return a short list of candidates and counting it correct whenever the true class lies in the list gives the top-\(n\) family of metrics.
Top-\(n\) accuracy: A prediction is counted as correct if the true class is among the \(n\) classes with the highest predicted probability. Let \(\mathcal {T}_n(\hat {\bp }_i)\) denote the set of indices of the \(n\) largest entries of \(\hat {\bp }_i\). Then
\(\seteqnumber{0}{}{0}\)\begin{equation} \text {Top-}n\text { accuracy} = \frac {1}{M}\sum _{i=1}^{M}\indFunc \!\left [y_i \in \mathcal {T}_n(\hat {\bp }_i)\right ], \end{equation}
where \(\indFunc [\cdot ]\) is the indicator function (Sec. B.2). Top-\(1\) accuracy coincides with ordinary accuracy. Top-\(n\) accuracy is non-decreasing in \(n\) and reaches \(100\%\) at \(n=C\). Top-\(5\) is the conventional companion to top-\(1\) on ImageNet-scale benchmarks.
Top-\(n\) error: The complement of top-\(n\) accuracy: the fraction of samples for which the true class is not among the \(n\) most probable predictions,
\(\seteqnumber{0}{}{1}\)\begin{equation} \text {Top-}n\text { error} = 1 - \text {Top-}n\text { accuracy} = \frac {1}{M}\sum _{i=1}^{M}\indFunc \!\left [y_i \notin \mathcal {T}_n(\hat {\bp }_i)\right ]. \end{equation}
ImageNet leaderboards (Sec. 17.2.3) conventionally report top-\(5\) error, because once accuracy reaches the high \(90\,\%\) range, differences are easier to read on the error scale (e.g. \(5.1\,\%\) vs. \(3.6\,\%\) rather than \(94.9\,\%\) vs. \(96.4\,\%\)).
-
Example 18.1: A 5-class image classifier produces the following probability vectors on four test images (true-class probability in bold):
\(i\) true \(\hat p_1\) \(\hat p_2\) \(\hat p_3\) \(\hat p_4\) \(\hat p_5\) top-1 top-3 1 2 0.10 0.55 0.20 0.10 0.05 yes yes 2 4 0.40 0.30 0.15 0.10 0.05 no no 3 3 0.05 0.10 0.30 0.45 0.10 no yes 4 1 0.50 0.20 0.15 0.10 0.05 yes yes For sample 3, the top-3 predicted classes are \(\{4,3,2\}\), which contains the true class 3, so the prediction counts as correct under top-\(3\). Aggregating:
\(\seteqnumber{0}{}{2}\)\begin{equation*} \text {Top-1 accuracy} = \frac {2}{4} = 50\%, \qquad \text {Top-3 accuracy} = \frac {3}{4} = 75\%. \end{equation*}
The gap reveals that the classifier often ranks the correct class highly even when its top-\(1\) pick is wrong, suggesting that the model has captured useful structure that a stricter accuracy measure obscures.
Class-averaged metrics
Macro-\(F_1\) and balanced accuracy (Sec. 12.6.2): per-class \(F_1\) or recall averaged uniformly across classes. Mandatory on long-tailed datasets where top-1 is dominated by the majority classes.
18.2.2 Practical recipe
Table 18.1 summarises a representative set of available models. Three families recur:
-
• Mobile/edge (MobileNetV3, EfficientNet-B0): \(\le 10\) M parameters, optimised for latency on CPU/mobile.
-
• General-purpose (ResNet-50, EfficientNet-B4, ConvNeXt-Tiny, ViT-B/16): \(20\)–\(90\) M parameters, the default starting point when no hard latency budget applies.
-
• High-capacity (ConvNeXt-Large, ViT-L/16 and bigger): hundreds of millions of parameters.
To quantify model size and computational complexity, we use parameter counts (associated with memory footprint) and multiply-accumulate operations (MACs, associated with latency and computational cost).
Multiply-accumulate operation (MAC): A multiply-accumulate operation (MAC) computes the product of two numbers and adds that product to an accumulator:
\(\seteqnumber{0}{}{2}\)\begin{equation} a \;\leftarrow \; a \;+\; (b \;\times \; c) . \end{equation}
In the context of deep learning, a MAC operation (consisting of one multiplication and one addition) represents the fundamental computation in dot products, matrix multiplications, and convolutions. A single MAC is approximately equivalent to two floating-point operations (FLOPs):
\(\seteqnumber{0}{}{3}\)\begin{equation} \text {FLOPs} \;\approx \; 2 \;\times \; \text {MACs} . \end{equation}
| Backbone | Params [M] | MACs [G] | Top-1 [%] |
| MobileNetV3-Large | 5.5 | 0.22 | 75.2 |
| EfficientNet-B0 | 5.3 | 0.39 | 77.1 |
| ResNet-18 | 11.7 | 1.8 | 69.8 |
| ResNet-50 | 25.6 | 4.1 | 76.1 |
| EfficientNet-B4 | 19 | 4.2 | 82.9 |
| ConvNeXt-Tiny | 28 | 4.5 | 82.1 |
| ViT-B/16 | 86 | 17.6 | 81.8 |
| ConvNeXt-Base | 89 | 15.4 | 83.8 |
| ConvNeXt-Large | 198 | 34.4 | 84.3 |
Doubling parameters buys a few accuracy points
An accuracy point here means one absolute percentage point on the Top-1 column of Table 18.1 (e.g. moving from \(76.1\%\) to \(77.1\%\) is a gain of one point). The gap between ResNet-50 and ConvNeXt-Large is roughly \(8\) points despite an \(8\times \) parameter increase. Pick the smallest model whose accuracy clears the application threshold.
18.2.3 Loss (*)
For single-label classification with one-hot target \(\by \in \{0,1\}^C\) (Sec. 9.1.3) and softmax probabilities \(\bp =g_\phi (\bz )\in \Delta ^{C-1}\) (the probability simplex; Sec. 16.3), the categorical cross-entropy is
\(\seteqnumber{0}{}{4}\)\begin{equation} \mathcal {L}_{\text {CE}} \;=\; -\sum _{c=1}^{C} y_c\,\log p_c \;=\; -\log p_{y} , \label {eq-dlarch-cls-ce} \end{equation}
where \(y\) denotes the index of the true class. Two refinements are routine:
Focal loss
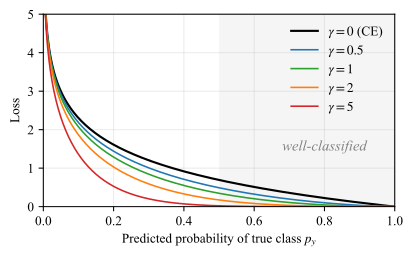
The cross-entropy contribution of an example with predicted true-class probability \(p_y\) is \(-\log p_y\), which remains non-negligible even when \(p_y\) is already large. With many easy examples (the typical regime when one class dominates), their summed gradient swamps the contribution of the few hard ones. Focal loss multiplies CE by a modulating factor that vanishes as \(p_y\to 1\),
\(\seteqnumber{0}{}{5}\)\begin{equation} \mathcal {L}_{\text {focal}} \;=\; -(1-p_y)^\gamma \,\log p_y , \label {eq-dlarch-focal} \end{equation}
where \(\gamma \ge 0\) controls the steepness: \(\gamma =0\) recovers CE and larger \(\gamma \) flattens the loss in the well-classified region (Fig. 18.1). Concretely, at \(p_y=0.9\) (an easy example), CE is \(-\log 0.9\approx 0.105\) while focal with \(\gamma =2\) scales it by \((1-0.9)^2=0.01\) down to \(\approx 0.00105\), a \(100\times \) down-weighting. At \(p_y=0.1\) (a hard example), the factor \((1-0.1)^2=0.81\) leaves the loss almost untouched, so the gradient is redirected toward the hard examples.
18.3 Image Segmentation
Throughout this subsection:
-
• \(\bM \in \{0,1,\ldots ,C\}^{H\times W}\) is the ground-truth label map,
-
• \(\hat \bM = f_\theta (\bX )\) the predicted label map, and
-
• \(|\cdot |\) denotes pixel count.
Background and foreground
One class index is reserved for the background (\(c=0\)): pixels that do not belong to any object of interest (sky, empty tissue, unlabelled regions). All other classes (\(c=1,\dots ,C\)) are foreground classes (tumour, road, vehicle, sheep), so \(C\) counts the foreground classes only and the total number of class indices is \(C+1\).
In a binary problem (\(C=1\)) there is a single foreground class and \(y_i\in \{0,1\}\) indicates whether pixel \(i\) belongs to it. With multiple foreground classes, each is treated separately when computing per-class losses and metrics: class \(c\) is its own foreground (\(y_i^{(c)}=1\)) and every other label, including the background (one-vs-rest), is its background (\(y_i^{(c)}=0\)). Foreground classes are typically the minority, and the pixel fraction each one occupies drives most of the design choices below (loss, metrics, sampling).
Objectives
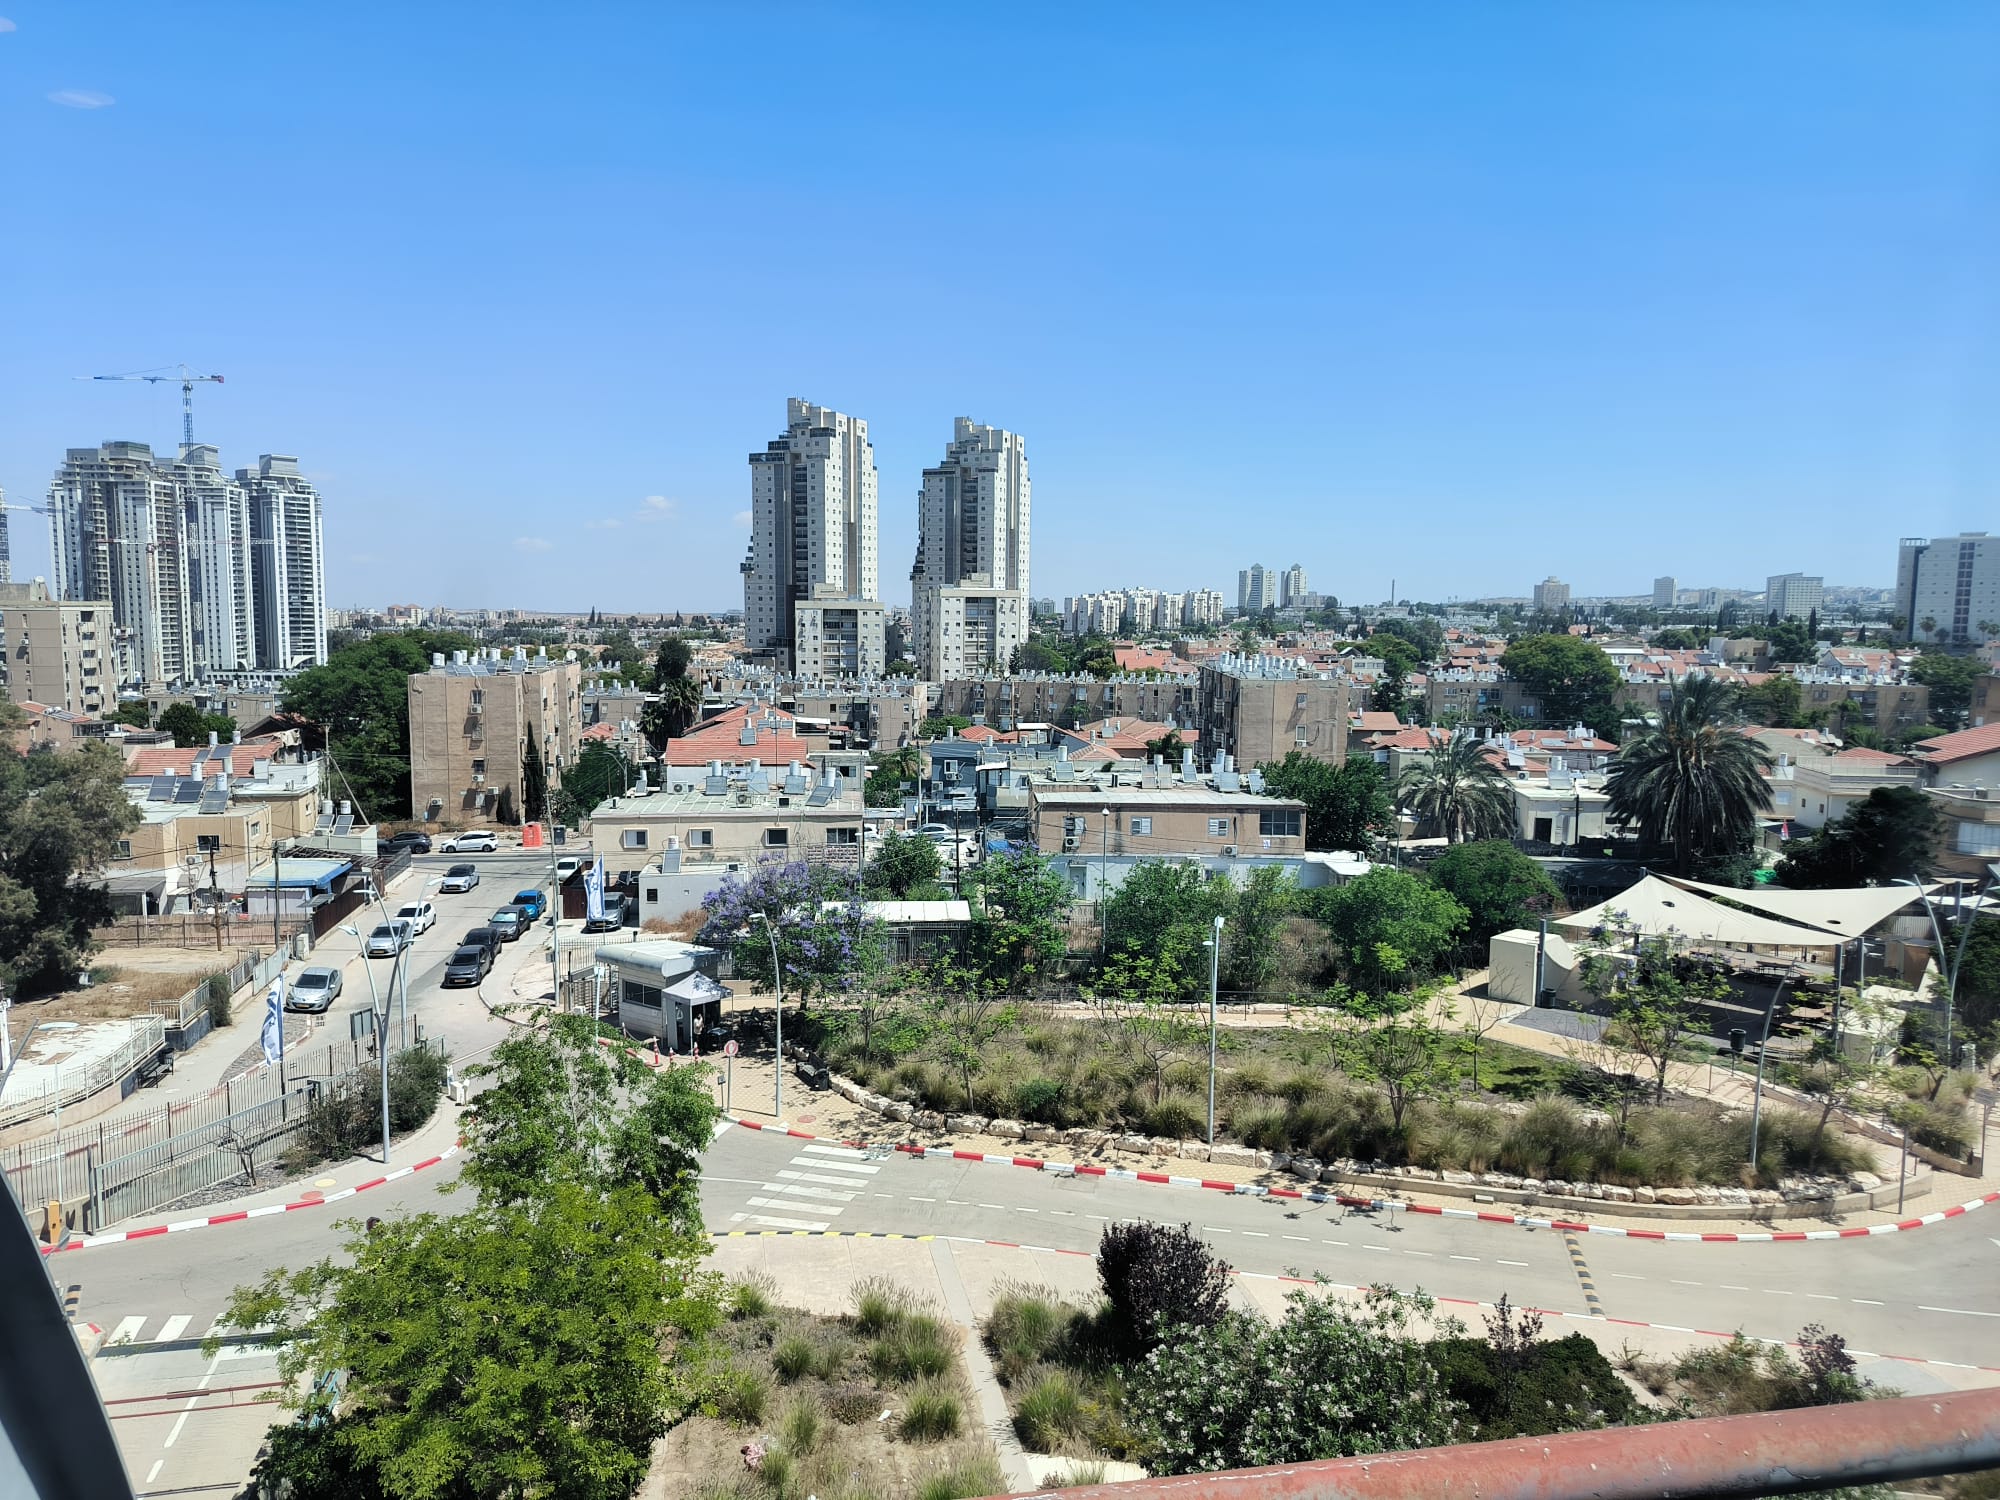
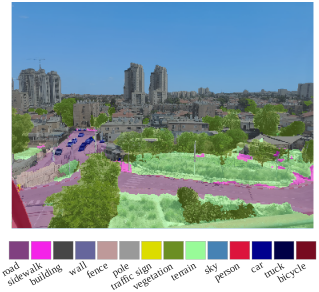
Image segmentation comes in three flavors, distinguished by what each pixel of the output carries. It is useful to split classes into
-
• stuff (uncountable regions: sky, road, grass) and
-
• things (countable objects: sheep, car, person).
The corresponding objectives are:
-
• Semantic segmentation: every pixel gets a single class label \(c\in \{0,\dots ,C\}\). Two sheep standing side by side are merged into one connected sheep region; the model cannot tell them apart.
-
• Instance segmentation: every thing pixel gets a pair (class, instance id), so the two sheep receive different ids; stuff pixels (sky, road) are left unlabelled.
-
• Panoptic segmentation: every pixel gets a pair (class, instance id). Things receive a unique id per object; each stuff class shares one id. It is a strict superset of the two above.
-
Example 18.2 (Two sheep on a road): Consider a \(2\times 4\) toy image (see also Fig. 18.2) with sky in the top row, road in the bottom row, and two sheep occupying the bottom-left and bottom-right pixels. Let class indices be \(\texttt {sky}=0\), \(\texttt {road}=1\), \(\texttt {sheep}=2\). The three flavors produce
\[ \underbrace {\begin {pmatrix}0&0&0&0\\2&1&1&2\end {pmatrix}}_{\text {semantic}},\quad \underbrace {\begin {pmatrix}\varnothing &\varnothing &\varnothing &\varnothing \\(2,1)&\varnothing &\varnothing &(2,2)\end {pmatrix}}_{\text {instance}},\quad \underbrace {\begin {pmatrix}(0,1)&(0,1)&(0,1)&(0,1)\\(2,1)&(1,1)&(1,1)&(2,2)\end {pmatrix}}_{\text {panoptic}} . \]
Semantic loses the count (one sheep region or two cannot be recovered from the label map); instance recovers the count but ignores sky and road; panoptic labels every pixel and distinguishes the two sheep.

Note, per-pixel annotation is expensive.
Counter-indications for segmentation:
-
• If a single image-level label suffices, use a classifier that cheaper to label, train and run (Sec. 18.2).
-
• If approximate locations of multiple objects are enough, use detection (Sec. 18.4).
18.3.1 Pixel Accuracy
Pixel-level confusion matrix A multi-class confusion matrix \(N\in \mathbb {N}^{(C+1)\times (C+1)}\) (the per-pixel analogue of the per-sample matrix of Sec. 12.6.1),
\(\seteqnumber{0}{}{6}\)\begin{equation} N_{cc'} \;=\; \sum _{i,j} \indFunc \!\left [M_{ij}=c\right ]\,\indFunc \!\left [\hat M_{ij}=c'\right ] , \end{equation}
counts how many pixels of true class \(c\) are predicted as \(c'\). Every per-pixel metric below is a simple function of \(N\).
Pixel accuracy Pixel accuracy is the diagonal sum normalized by total pixels,
\(\seteqnumber{0}{}{7}\)\begin{equation} \text {PA} \;=\; \frac {\sum _c N_{cc}}{\sum _{c,c'} N_{cc'}} , \label {eq-dlarch-pa} \end{equation}
treating each pixel as an equal-weight classification example.
Per-class pixel accuracy The per-class pixel accuracy is the fraction of class-\(c\) pixels recovered,
\(\seteqnumber{0}{}{8}\)\begin{equation} \text {PA}_c \;=\; \frac {N_{cc}}{\sum _{c'} N_{cc'}} \;=\; \frac {\text {TP}_c}{\text {TP}_c+\text {FN}_c} , \end{equation}
which is the recall on class \(c\). The denominator \(\sum _{c'} N_{cc'}\) is the row-\(c\) sum of the confusion matrix, i.e. the number of pixels whose true label is \(c\), counted across every predicted class \(c'\).
\(\seteqnumber{0}{}{9}\)\begin{equation} \text {mPA} \;=\; \frac {1}{C+1}\sum _c \text {PA}_c \;=\; \frac {1}{C+1}\sum _c \frac {N_{cc}}{\sum _{c'} N_{cc'}} \end{equation}
averages \(\text {PA}_c\) equally over the \(C+1\) classes (\(+1\) stands for the background class). It is the macro-averaged per-class recall (Sec. 12.6.2), less biased by class frequency than PA.
18.3.2 Intersection over Union
Definition
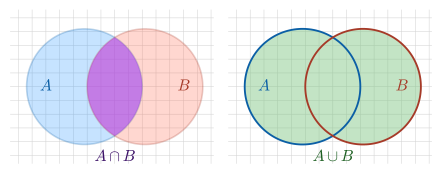
For two regions \(A\) and \(B\) (pixel sets, or, in Sec. 18.4, bounding boxes) the Intersection over Union (IoU, also called the Jaccard index) is
\(\seteqnumber{0}{}{10}\)\begin{equation} \text {IoU}(A,B) \;=\; \frac {|A\cap B|}{|A\cup B|} \;=\; \frac {|A\cap B|}{|A|+|B|-|A\cap B|} , \label {eq-dlarch-iou} \end{equation}
with \(\text {IoU}\in [0,1]\) (\(1\) for perfect overlap, \(0\) for disjoint regions).
Why IoU and not pixel accuracy? IoU penalises both false positives (predicted pixels outside the ground truth) and false negatives (ground-truth pixels missed). Pixel accuracy on a sparse foreground class can stay near \(1\) even when the model predicts everything as background; IoU collapses to \(0\) in that case.
IoU per class
For class \(c\), treating “class \(c\)” vs. “not class \(c\)” as a binary problem, apply the IoU definition (Eq. 18.11) with \(B=\{\,\text {pixels with } M_{ij}=c\,\}\) (the actual class-\(c\) region) and \(A=\{\,\text {pixels with } \hat M_{ij}=c\,\}\) (the predicted class-\(c\) region). The matrix entries read out the three set cardinalities directly:
-
• \(|A\cap B| = N_{cc} = \text {TP}_c\) — pixels that are class \(c\) in both the truth and the prediction (diagonal entry);
-
• \(|B| = \sum _{c'} N_{cc'} = \text {TP}_c + \text {FN}_c\) — row-\(c\) sum, all actual class-\(c\) pixels;
-
• \(|A| = \sum _{c'} N_{c'c} = \text {TP}_c + \text {FP}_c\) — column-\(c\) sum, all predicted class-\(c\) pixels.
-
• \(|A\cup B|=|A|+|B|-|A\cap B|\) - inclusion-exclusion formula.
Substituting into Eq. 18.11 gives
\(\seteqnumber{0}{}{11}\)\begin{equation} \text {IoU}_c \;=\; \frac {N_{cc}}{\sum _{c'} N_{cc'} + \sum _{c'} N_{c'c} - N_{cc}} \;=\; \frac {\text {TP}_c}{\text {TP}_c + \text {FP}_c + \text {FN}_c} . \end{equation}
Mean IoU
The mean IoU averages over classes,
\(\seteqnumber{0}{}{12}\)\begin{equation} \text {mIoU} \;=\; \frac {1}{C+1}\sum _{c=0}^{C} \text {IoU}_c , \label {eq-dlarch-miou} \end{equation}
and is the de-facto reporting metric. A frequency-weighted variant is
\(\seteqnumber{0}{}{13}\)\begin{equation} \text {fwIoU}=\sum _c f_c\,\text {IoU}_c \end{equation}
with \(f_c\) the pixel frequency of class \(c\) (the fraction of all pixels whose true label is \(c\)).
Median IoU
The median IoU is a robust alternative,
\(\seteqnumber{0}{}{14}\)\begin{equation} \text {medIoU} \;=\; \operatorname *{median}_{c=0,\dots ,C}\,\text {IoU}_c , \label {eq-dlarch-mediou} \end{equation}
useful on long-tailed benchmarks: a single rare class whose IoU collapses to near zero can drag mIoU down disproportionately, while medIoU is unaffected by such per-class outliers. It is sometimes reported alongside mIoU rather than instead of it.
What counts as a good (m)IoU? There is no universal cutoff, but on standard benchmarks:
-
• \(\text {mIoU}<0.5\): typically weak; usually a sign of class imbalance or that boundary errors dominate.
-
• \(0.5\)–\(0.7\): typical range for hard datasets.
-
• \(0.7\)–\(0.8\): strong; current SOTA.
-
• \(>0.9\): near-perfect, realistic only for easy or binary masks.
Per-class IoU varies widely within a single model: background and large classes routinely sit at \(0.9+\), while thin or rare classes (poles, pedestrians, lesions) often languish at \(0.3\)–\(0.5\) even for SOTA. This spread is why mIoU is always reported alongside per-class values.
18.3.3 Dice coefficient
The Dice coefficient (the \(F_1\) score in its binary form) is
\(\seteqnumber{0}{}{15}\)\begin{equation} \text {Dice}(A,B) \;=\; \frac {2|A\cap B|}{|A|+|B|} \;=\; \frac {2\,\text {TP}}{2\,\text {TP}+\text {FP}+\text {FN}} . \label {eq-dlarch-dice} \end{equation}
Dice and IoU are monotone transforms of each other,
\(\seteqnumber{0}{}{16}\)\begin{equation} \label {eq-dice-iou} \text {Dice} \;=\; \frac {2\,\text {IoU}}{1+\text {IoU}} , \qquad \text {IoU} \;=\; \frac {\text {Dice}}{2-\text {Dice}} , \end{equation}
so they rank methods identically; Dice gives a higher score for the same overlap (Fig. 18.6).
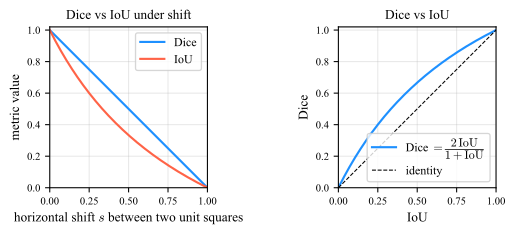
In medical imaging Dice is the dominant choice; in autonomous driving and general computer vision IoU is. The choice is conventional, so do not report both as if they were independent evidence.
On datasets where one class covers most pixels (typical for medical or satellite imagery) PA is misleading: predicting all-background scores near \(1\) in PA but \(0\) in mIoU. Always report mIoU or per-class IoU on imbalanced data.
-
Example 18.3 (Pixel metrics on a \(4\times 4\) image): A binary segmentation problem (foreground vs. background) on a \(4\times 4\) image. Ground truth \(\bM \) has the foreground (class \(1\)) in the top-left \(2\times 2\) block; the prediction \(\hat \bM \) has it shifted one pixel to the right:
\(M ={}\)
1100110000000000\(\hat M ={}\)
0110011000000000Cells are shaded by the class-\(1\) outcome: TP, FP, FN, TN. Compute pixel accuracy, and the IoU and Dice for each class.
-
Solution: For the foreground (class \(1\)) the per-pixel counts are \(\text {TP}=2\), \(\text {FP}=2\), \(\text {FN}=2\), \(\text {TN}=10\). Then
\(\seteqnumber{0}{}{17}\)\begin{align*} \text {PA} &= (2+10)/16 = 0.75 , \\ \text {IoU}_1 &= 2/(2+2+2) = 1/3 \approx 0.33 , \\ \text {Dice}_1 &= 2\cdot 2/(2\cdot 2+2+2) = 1/2 = 0.50 . \end{align*} For the background (class \(0\)) the roles swap: its \(\text {TP}_0=10\) are the class-\(1\) true negatives, while the class-\(1\) FP and FN become \(\text {FN}_0=2\) and \(\text {FP}_0=2\). Then
\(\seteqnumber{0}{}{17}\)\begin{align*} \text {IoU}_0 &= 10/(10+2+2) = 5/7 \approx 0.71 , \\ \text {Dice}_0 &= 2\cdot 10/(2\cdot 10+2+2) = 5/6 \approx 0.83 , \end{align*} so \(\text {mIoU}=(\text {IoU}_0+\text {IoU}_1)/2\approx 0.52\). PA looks reasonable, but IoU exposes that only one third of the foreground union is correctly predicted; the large background inflates both PA and the background’s own scores, which is why the foreground IoU (or mIoU) is the honest summary. Dice falls between PA and IoU as expected from (18.17).
18.3.4 Hausdorff distance
IoU and Dice score area overlap and are dominated by the interior of large objects, so a prediction can score well even while its boundary wanders far from the truth in a few places. The Hausdorff distance measures exactly that: the largest gap between the two boundaries (Fig. 18.7). It is the distance-based complement to the overlap metrics above and the standard companion to Dice in medical imaging, where contour carries clinical information (cf. the boundary metrics in Sec. 18.3.3). This distance exists in multiple variants.
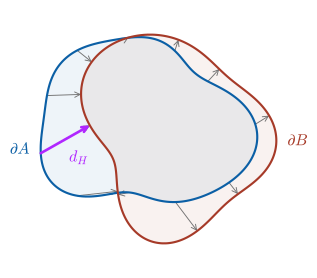
The Hausdorff distance is a length, not a ratio in \([0,1]\): it has no fixed scale and is comparable across results only at a fixed image resolution and voxel spacing.
18.3.5 Panoptic quality
Panoptic quality (PQ) grades a result at the level of whole segments rather than individual pixels. It is built in two stages, as follows.
Step 1: match segments Pair a predicted segment \(p\) with a ground-truth segment \(g\) only when their mask overlap clears \(\text {IoU}(p,g)>0.5\).
The threshold of 0.5 is what keeps the matching clean: no two predictions can both exceed \(0.5\) IoU with the same ground truth, so each ground truth matches at most one prediction and the pairing is unique. The matching sorts every segment into three counts (segment-level, not pixels):
-
• \(\text {TP}\) – matched pairs \((p,g)\);
-
• \(\text {FP}\) – predicted segments with no matching ground truth (spurious detections);
-
• \(\text {FN}\) – ground-truth segments with no matching prediction (misses).
Step 2: grade with two questions A good panoptic result must answer two independent questions, and PQ measures each with its own factor.
-
• Did the model find the right segments? This is recognition quality (RQ), the \(F_1\) score over segments, treating each segment as one classification example:
\(\seteqnumber{0}{}{17}\)\begin{equation*} \text {RQ} \;=\; \frac {|\text {TP}|}{|\text {TP}|+\tfrac 12|\text {FP}|+\tfrac 12|\text {FN}|} . \end{equation*}
The \(\tfrac 12\) weights split each unmatched segment evenly between FP and FN, the standard \(F_1\) form.
-
• When it does find a segment, how tightly does the mask fit? This is segmentation quality (SQ), the mean IoU over the matched pairs only (unmatched segments do not enter):
\(\seteqnumber{0}{}{17}\)\begin{equation*} \text {SQ} \;=\; \frac {\sum _{(p,g)\in \text {TP}}\text {IoU}(p,g)}{|\text {TP}|} . \end{equation*}
Step 3: combine Panoptic quality is the product of the two factors,
\(\seteqnumber{0}{}{17}\)\begin{equation} \text {PQ} \;=\; \underbrace {\frac {\sum _{(p,g)\in \text {TP}}\text {IoU}(p,g)}{|\text {TP}|}}_{\text {SQ}} \;\times \; \underbrace {\frac {|\text {TP}|}{|\text {TP}|+\tfrac 12|\text {FP}|+\tfrac 12|\text {FN}|}}_{\text {RQ}} . \label {eq-dlarch-pq} \end{equation}
Because it is a product, a high PQ demands both: detect the right segments (high RQ) and outline them tightly (high SQ). A model that detects everything with sloppy masks, or produces a few perfect masks while missing most objects, scores poorly.
-
Example 18.4 (Panoptic quality on a small image): A panoptic prediction returns four segments \(\hat I_1,\ldots ,\hat I_4\) on an image whose ground truth contains three segments \(I_1,I_2,I_3\). The pairwise mask IoUs between candidate pairs are
\[ \text {IoU}(\hat I_1,I_1)=0.82,\quad \text {IoU}(\hat I_2,I_2)=0.61,\quad \text {IoU}(\hat I_4,I_3)=0.34, \]
and all other pairs have IoU \(=0\). The matching at threshold \(0.5\) is shown in Fig. 18.8. Compute SQ, RQ and PQ.
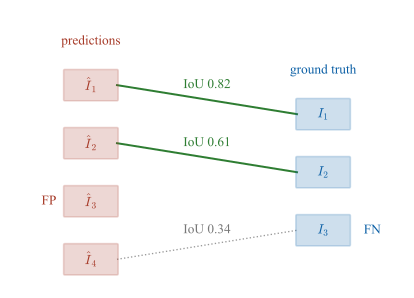 Figure 18.8: Matching predicted instances \(\hat I_k\) to ground-truth instances \(I_k\) by mask IoU at threshold \(0.5\). Solid green lines mark TP pairs (IoU above \(0.5\)); the dotted gray line is a below-threshold candidate that fails to match. Unmatched predictions become FP, unmatched ground truths become FN.
-
-
1. Match segments
Apply the \(0.5\) threshold. Only \((\hat I_1,I_1)\) at \(0.82\) and \((\hat I_2,I_2)\) at \(0.61\) clear \(\text {IoU}>0.5\), so they form the TP set; \((\hat I_4,I_3)\) at \(0.34\) does not match. Reading off the figure, the counts are
\[ |\text {TP}|=2 ,\qquad \underbrace {|\text {FP}|=2}_{\hat I_3,\,\hat I_4\ \text {unmatched}} ,\qquad \underbrace {|\text {FN}|=1}_{I_3\ \text {unmatched}} . \]
-
2. Grade with two questions
Recognition first, then mask fit:
\(\seteqnumber{0}{}{18}\)\begin{align*} \text {RQ} &= \frac {|\text {TP}|}{|\text {TP}|+\tfrac 12|\text {FP}|+\tfrac 12|\text {FN}|} = \frac {2}{2 + \tfrac 12\cdot 2 + \tfrac 12\cdot 1} = \frac {2}{3.5} \approx 0.571 , \\ \text {SQ} &= \frac {\text {IoU}(\hat I_1,I_1)+\text {IoU}(\hat I_2,I_2)}{|\text {TP}|} = \frac {0.82+0.61}{2} = 0.715 . \end{align*}
-
3. Combine
Multiply the two factors (Eq. 18.18),
\[ \text {PQ} = \text {SQ}\times \text {RQ} \approx 0.715\times 0.571 \approx 0.408 . \]
The matched masks overlap fairly well on average (SQ \(\approx 0.72\)), but two spurious predictions and a missed ground truth drag RQ down to \(0.57\), and the product punishes the model in both dimensions at once.
-
What counts as a good PQ? There is no universal cutoff, but on standard panoptic benchmarks:
-
• \(\text {PQ}<0.3\): typically weak; usually means many segments are unmatched or masks are loose.
-
• \(0.3\)–\(0.4\): typical range for hard datasets.
-
• \(0.4\)–\(0.55\): strong.
-
• \(0.55\)–\(0.65\): SOTA.
-
• \(>0.7\): near-perfect, realistic only for easy or binary cases.
Because \(\text {PQ}=\text {SQ}\times \text {RQ}\), a low PQ alone is ambiguous: report SQ and RQ separately to localise the problem (loose masks vs. poor detection).
18.3.6 Instance segmentation
Evaluation reuses the detection recipe of Sec. 18.4.1 below, with mask IoU (Eq. 18.11 applied to per-instance binary masks) replacing box IoU. The standard mask-AP metric is the COCO (Sec. 18.1) mAP averaged over IoU thresholds \(\{0.5,0.55,\ldots ,0.95\}\) (mAP@[.5:.95], Eq. 18.24) applied to masks instead of boxes.
Inference hyperparameters Two deployment-time knobs sit between the network output and the reported metric:
-
• Score threshold \(\tau _{\text {score}}\): the confidence below which predicted segments are dropped before any TP/FP/FN counting. For computing mAP, keep \(\tau _{\text {score}}\) low (e.g. \(0.05\)) so the precision–recall curve is sampled across the full operating range (Sec. 18.4.1). For visualisation or deployment, raise it (e.g. \(0.5\)–\(0.7\)) so only confident segments are shown.
-
• Mask threshold \(\tau _{\text {mask}}\): the per-pixel probability cutoff that binarises the soft mask into \(\{0,1\}\) at inference, \(\hat M_{ij} = \indFunc [p_{ij} > \tau _{\text {mask}}]\) (the same \(0.5\) choice that defines the hard-mask Dice loss in Sec. 18.3.3 below). Lower it to grow masks (boosts recall, may merge instances); raise it to shrink them (boosts precision, may fragment).
Both \(\tau _{\text {score}}\) and \(\tau _{\text {mask}}\) change the reported mask IoU and PQ even with the network frozen, because both metrics are computed on the binarised, score-filtered prediction. Reporting numbers without disclosing the two thresholds is a common reproducibility gap.
18.3.7 Dice Loss
Definition
The baseline is per-pixel cross-entropy summed over the \(H\times W\) grid, identical to a classification CE applied independently at every pixel. On imbalanced foreground (small lesions on large background, thin roads on large satellite tiles), CE alone underweights the minority class and the model collapses toward the background.
The Dice loss addresses this directly. In the binary case (background and foreground, \(C=1\)),
\(\seteqnumber{0}{}{18}\)\begin{equation} \mathcal {L}_{\text {Dice}} \;=\; 1 \;-\; \frac {2\sum _i p_i\,y_i}{\sum _i p_i + \sum _i y_i} , \end{equation}
where \(p_i\in [0,1]\) is the predicted foreground probability and \(y_i\in \{0,1\}\) the ground-truth indicator at pixel \(i\) (with \(i\) ranging over all \(HW\) pixels). Each of the three sums has a direct interpretation:
-
• \(\sum _i y_i = |B|\) counts the foreground pixels in the ground-truth mask,
-
• \(\sum _i p_i\) is the soft analogue of \(|A|\): the expected number of foreground pixels predicted by the model, where each pixel contributes its probability rather than a \(\{0,1\}\) vote, and
-
• \(\sum _i p_i\,y_i\) measures their soft overlap (the predicted probability summed over the true foreground pixels).
Two variants share this formula and differ only in the input.
-
• The soft Dice loss is \(\mathcal {L}_{\text {Dice}}\) as written above: the inputs are the continuous probabilities \(p_i\in [0,1]\), so the loss is differentiable in the model parameters and can drive training.
-
• The hard-mask Dice loss replaces \(p_i\) with the thresholded mask \(\hat p_i = \indFunc [p_i > 0.5]\in \{0,1\}\) before the same formula is evaluated; the three sums then become the cardinalities \(|B|\), \(|A|\) and \(|A\cap B|\), recovering the set-based Dice coefficient of Eq. 18.16 (Sec. 18.3.3). Training therefore uses the soft form (gradient everywhere); evaluation reports the hard form (matches the set-based coefficient that humans interpret).
Motivation (*)
Because Dice definition in 18.17 makes it a strictly increasing function of IoU, minimising \(\mathcal {L}_{\text {Dice}}\) is equivalent to maximising IoU: any drop in the loss is a guaranteed gain in IoU on the same prediction, so the loss and the evaluation metric rank predictions in the same order.
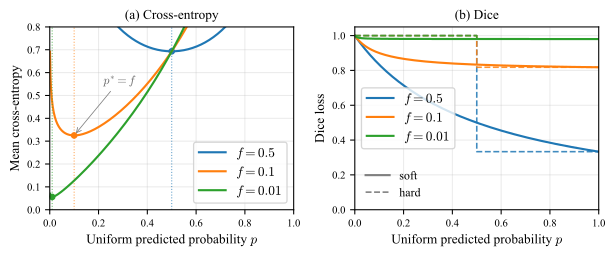
The second advantage is robustness to class imbalance. Let \(f = \tfrac {1}{HW}\sum _i y_i\) denote the foreground fraction (the share of pixels of foreground). For per-pixel cross-entropy with a constant-probability predictor \(p_i\equiv p\) (every pixel’s predicted foreground probability \(p_i\) is the same scalar \(p\), so the loss is a function of one number instead of \(HW\)), the optimum is \(p^*=f\): as \(f\to 0\), CE rewards the model for predicting all-background and the foreground gradient vanishes. Dice loss has no such collapse, because its ratio is scale-invariant in the foreground set: doubling \(\sum _i y_i\) and \(\sum _i p_i y_i\) together leaves \(\mathcal {L}_{\text {Dice}}\) unchanged, so a tiny foreground is not automatically a small loss. Figure 18.9 shows both behaviours side by side at three foreground fractions:
-
• \(f=0.5\) – balanced (a roughly 50/50 split, e.g. generic binary classification). The CE optimum sits at \(p^{*}=0.5\) (middle dotted line in panel a); CE and soft Dice agree on direction, both descending together as \(p\to 1\). The hard-mask Dice loss in panel b drops from \(1\) (all-background, \(p\le 0.5\)) to \((1-f)/(1+f)=1/3\) (all-foreground, \(p>0.5\)) – a clear improvement, though Dice\(=2/3\) is still far from a good prediction.
-
• \(f=0.1\) – mildly imbalanced (typical foreground objects in natural images). The CE optimum has slid left to \(p^{*}=0.1\): a model that admits only \(10\%\) foreground confidence is already CE-optimal, while soft Dice keeps decreasing all the way to \(p=1\) and its gradient still asks for more foreground confidence. Hard-mask Dice plateaus at \((1-f)/(1+f)\approx 0.82\) on \(p>0.5\).
-
• \(f=0.01\) – severely imbalanced (small lesions in medical scans, thin roads in satellite tiles). The CE optimum collapses against the left axis: predicting all-background is essentially optimal and the foreground gradient is negligible. Soft Dice is still monotone-decreasing in \(p\), but the hard-mask Dice loss only drops to \(\approx 0.98\) even after thresholding everything to foreground – which is why training uses the soft form rather than thresholding inside the loss.
-
Example 18.5 (Dice loss on three predictors): Take the \(4\times 4\) ground-truth mask of the pixel-metrics example (Example 18.3), foreground in the top-left \(2\times 2\) block (\(f=4/16=0.25\)). Compute the hard-mask Dice loss for three predictions: (A) all-background \(\hat M\equiv 0\); (B) the foreground shifted one pixel to the right (TP\(=\)FP\(=\)FN\(=2\)); (C) an exact match. For each, also report pixel accuracy (PA, Eq. 18.8, the share of correctly labelled pixels): does PA tell the degenerate predictor (A) apart from the partially-correct one (B), and does it agree with Dice on which prediction is worst?
-
Solution: With \(\text {Dice}=\tfrac {2\,\text {TP}}{2\,\text {TP}+\text {FP}+\text {FN}}\) and \(\mathcal {L}_{\text {Dice}}=1-\text {Dice}\):
\(\seteqnumber{0}{}{19}\)\begin{align*} \text {(A)}\quad & \text {TP}=0,\ \text {FP}=0,\ \text {FN}=4: && \mathcal {L}_{\text {Dice}} = 1 - 0/4 = 1, && \text {PA}=12/16=0.75, \\ \text {(B)}\quad & \text {TP}=2,\ \text {FP}=2,\ \text {FN}=2: && \mathcal {L}_{\text {Dice}} = 1 - 4/8 = 0.5, && \text {PA}=12/16=0.75, \\ \text {(C)}\quad & \text {TP}=4,\ \text {FP}=0,\ \text {FN}=0: && \mathcal {L}_{\text {Dice}} = 0, && \text {PA}=1. \end{align*} The degenerate all-background predictor (A) still scores \(\text {PA}=0.75\) because 12 of 16 pixels are background, yet \(\mathcal {L}_{\text {Dice}}=1\) flags it as the worst possible solution. (A) and (B) are indistinguishable to pixel accuracy but separated by \(0.5\) in Dice loss. This is precisely the imbalance regime where CE alone leaves the model stuck at (A); adding Dice to the loss restores a useful gradient.
Multi-class case. With \(C\) foreground classes and a softmax probability vector output \(\bp _i\in [0,1]^{C+1}\) at every pixel and the ground truth is the one-hot vector \(\by _i\). The Dice loss is computed per class against its one-vs-rest indicator and then averaged,
\(\seteqnumber{0}{}{19}\)\begin{equation} \mathcal {L}_{\text {Dice}}^{\text {multi}} \;=\; 1 \;-\; \frac {1}{C}\sum _{c=1}^{C}\frac {2\sum _i p_i^{(c)} y_i^{(c)}}{\sum _i p_i^{(c)} + \sum _i y_i^{(c)} + \varepsilon } , \end{equation}
where \(p_i^{(c)}\) is the softmax probability of class \(c\) at pixel \(i\), \(y_i^{(c)}\in \{0,1\}\) is the one-hot ground-truth indicator, and \(\varepsilon \) is a small constant (\(\sim 1\)) that prevents division by zero on images where a class is absent (\(\sum _i y_i^{(c)}=0\)). The background class \(c=0\) is excluded from the sum.
Practical recipe. The standard combined loss is \(\mathcal {L} = \mathcal {L}_{\text {CE}} + \mathcal {L}_{\text {Dice}}\) (binary or multi-class as appropriate), which keeps the per-pixel calibration of CE and the imbalance robustness of Dice.
Summary
-
• Evaluating segmentation on tiles that overlap training tiles. Large images (satellite scenes, histology slides, whole-slide MRI) do not fit in GPU memory and are cropped into smaller patches (tiles), often with deliberate overlap so objects on a tile boundary appear whole in some neighbouring tile. If train/test tiles are then drawn from the same source image (e.g. a random tile-level split), the test tiles share pixels with training tiles and the model has effectively memorised the answer for that region. The resulting IoU is dramatically inflated relative to performance on a truly unseen image. The fix is to split at the image level, not the tile level: all tiles from a given source image go to exactly one of train/val/test.
-
• Forgetting the void or ignore label (e.g. on Cityscapes, Sec. 18.1). Void pixels must be excluded from both numerator and denominator of every metric.
-
• Computing per-image mIoU and then averaging over images. The accepted convention is to accumulate the confusion matrix over the entire test set first and compute mIoU once.
Evaluate performance by mIoU on a held-out test set, accumulating the confusion matrix once over the whole set, and report per-class IoU on imbalanced data.
18.4 Object Detection
Detection sits at the end of a natural progression of image-level tasks, each adding one more degree of output complexity:
-
• Image classification (Sec. 18.2)
-
– Dataset provides one label per image, \(1\,\text {image}\to 1\,\text {class}\).
-
– Model output is a probability simplex \(\Delta ^{C}\) over the \(C\) classes.
-
-
• Classification with localization (currently not discussed in-depth in this chapter):
-
– Dataset provides one label and one bounding box for a single dominant object, \(1\,\text {image}\to 1\,\text {class}+1\,\text {box}\).
-
– Model output is a probability simplex \(\Delta ^{C}\) and four box coordinates. The output shape is still fixed, so a single regression head bolted onto a classifier suffices.
-
-
• Object detection (this section)
-
– Dataset provides a variable-length list of (class, box) annotations per image, \(1\,\text {image}\to N\,(\text {class}+\text {box})\) with \(N\) unknown in advance.
-
– Model output is a set of (class, box, score) tuples, where the score \(s\in [0,1]\) is a per-(box, class) confidence used to rank the prediction against others on the precision-recall curve (Sec. 18.4.1).
-
– Makes the output variable-length (an image may contain zero, one or many objects).
-
– Couples a regression (box coordinates) and a classification (class + objectness), evaluated jointly.
-
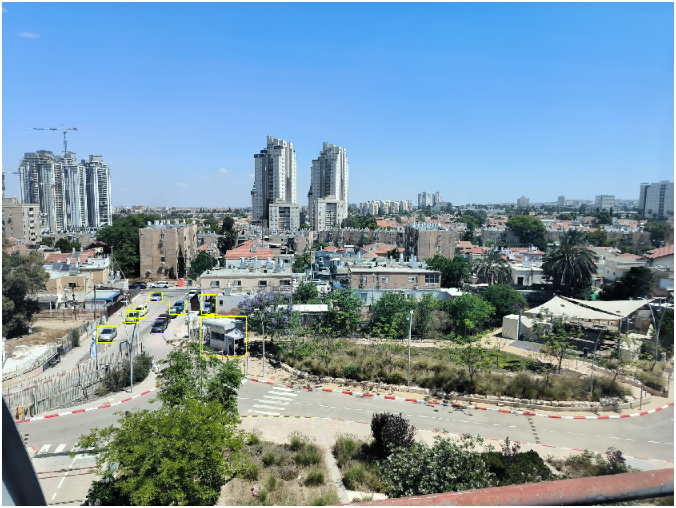
Bounding-box principle
A bounding box is the smallest axis-aligned rectangle that fully encloses an object in the image plane. Two equivalent four-number parameterizations are used:
-
• Corner form \(b=(x_1,y_1,x_2,y_2)\): top-left and bottom-right pixel coordinates, with \(x_1<x_2\) and \(y_1<y_2\). Convenient for IoU and matching (Sec. 18.4.1).
-
• Center-size form \(b=(x_c,y_c,w,h)\): box center and width/height, with each coordinate normalized to \([0,1]\) by dividing \(x_c,w\) by the image width and \(y_c,h\) by the image height. Normalization makes the four numbers resolution-independent: the same box parameters describe the object before and after resizing a \(1920\times 1080\) image to the \(640\times 640\) training crop, so one regression target stays valid across the multi-scale training augmentations and the variable camera resolutions seen at inference. The parameterization also decouples location (\(x_c,y_c\)) from scale (\(w,h\)).
The box carries no orientation (no rotation) and no shape information beyond the rectangle; tighter outlines require instance segmentation (Sec. 18.3). A box is considered correct, against a ground-truth box of the same class, when their overlap exceeds an IoU threshold (Sec. 18.4.1).
When to use it Detection is the right tool when you must locate and count multiple objects of possibly overlapping categories in a scene, and a bounding box is precise enough (otherwise use instance segmentation). Counter-indications:
-
• A single dominant object per image \(\to \) classifier (Sec. 18.2).
-
• Pixel-precise contours required \(\to \) segmentation (Sec. 18.3).
-
• Open-set identification (who is this person?) \(\to \) Siamese / embedding approach (Ch. 19).
18.4.1 Performance metrics
An object detector (the model being evaluated) outputs a set of scored boxes per image, and the metric has to collapse that set into a single comparable number. It does so through a four-stage pipeline, each stage feeding the next:
-
1. Match and label: pair each predicted box with a ground-truth box by bounding-box IoU, label it TP or FP, and count the missed ground truths as FN.
-
2. Sweep: vary the confidence cut-off to trace a precision–recall curve.
-
3. Integrate: collapse that curve into one average precision (AP) at a fixed IoU threshold.
-
4. Average: average AP over classes (mAP) and over IoU thresholds (mAP@[.5:.95]).
The subsections below walk these stages in order; non-maximum suppression is an inference-time aside (it reuses the same IoU test) inserted between Stages 1 and 2.
Box matching and TP/FP/FN labeling
Matching is done one class at a time and repeated identically for each class (Stage 4 then averages across classes).
The detector’s class-\(c\) predictions are a set of boxes \(\{\hat b_i\}\) with confidence scores \(\{s_i\}\), which must be scored against the class-\(c\) ground-truth boxes \(\{b_j\}\). Matching turns these two box sets into TP, FP, and FN counts.
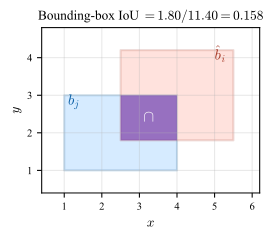
When does a box count as correct? Overlap is measured by the bounding-box IoU (Eq. 18.11, Fig. 18.11): a prediction can match a ground-truth box only if their IoU clears a threshold \(\tau \in [0,1]\) (Pascal VOC uses \(\tau =0.5\); a stricter \(\tau \) demands tighter boxes).
The matching rule Several predictions may overlap the same object, so to keep the count unambiguous they are matched greedily in order of confidence:
-
1. Sort the predictions by descending confidence scores \(\{s_i\}\) and walk down the list.
-
2. Each \(\hat b_i\) claims the still-unclaimed ground-truth box \(b_j\) with which its \(\text {IoU}(\hat b_i, b_j)\ge \tau \) is highest.
This sorts every box into one of three outcomes:
-
• True positive (TP): the claimed box clears \(\text {IoU}(\hat b_i, b_j)\ge \tau \), and that ground truth leaves the pool.
-
• False positive (FP): the prediction wins no valid claim, either because it overlaps no ground truth above \(\tau \) (a misplaced box) or because the ground truth it overlaps was already taken by a higher-scoring prediction (a duplicate detection).
-
• False negative (FN): a ground-truth box left unclaimed once every prediction has been processed.
Why there is no TN This reduces single-image detection to TP, FP, FN counts per class, almost the binary classification setting of Chapter 12. The missing fourth cell is TN: a true negative would be a correctly emitted “no object here” decision, but the negative space is every possible box in the image plane (infinitely many), so TN is undefined and not counted. This is why detection metrics use precision and recall (which need only TP, FP, FN) and never accuracy or specificity (which need TN).
What IoU threshold counts as a good match?
-
• \(\tau =0.5\): the lenient default; tolerates loose boxes and is what Pascal VOC (Sec. 18.1) adopted.
-
• \(\tau =0.75\): strict; requires tight localization.
-
• \(\tau \in \{0.5,0.55,\dots ,0.95\}\): averaging the metric over this range (rather than picking one \(\tau \)) is the COCO (Sec. 18.1) convention.
For a single image, \(\text {IoU}\ge 0.5\) usually looks visually correct; \(\text {IoU}\ge 0.9\) requires near-pixel-perfect box edges and is rare in practice.
-
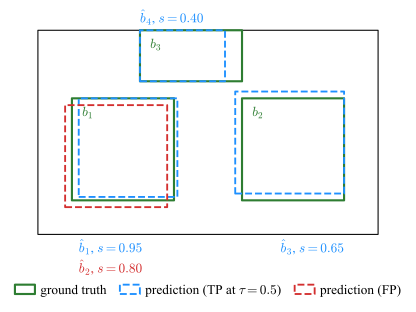
Example 18.6 (Box matching at IoU \(\tau =0.5\)): A small image (Fig. 18.12) contains three ground-truth boxes \(b_1,b_2,b_3\) and four predictions \(\hat b_1,\ldots ,\hat b_4\) sorted by descending confidence. The matrix of pairwise IoUs (zero entries omitted) is
\[ \begin {array}{c|c|ccc} & \text {score} & b_1 & b_2 & b_3 \\\hline \hat b_1 & 0.95 & 0.87 & \cdot & \cdot \\ \hat b_2 & 0.80 & 0.77 & \cdot & \cdot \\ \hat b_3 & 0.65 & \cdot & 0.82 & \cdot \\ \hat b_4 & 0.40 & \cdot & \cdot & 0.83 \end {array} \]
Apply the greedy descending-confidence rule at \(\tau =0.5\): classify each prediction as TP or FP and identify any FN.
-
-
1. Walk the score-sorted list and match
Dispatch each prediction in descending-confidence order, letting it claim its highest-IoU still-unclaimed ground truth:
rank prediction score best GT IoU decision 1 \(\hat b_1\) 0.95 \(b_1\) 0.87 TP – claims \(b_1\) 2 \(\hat b_2\) 0.80 \(b_1\) 0.77 FP – duplicate, \(b_1\) already claimed 3 \(\hat b_3\) 0.65 \(b_2\) 0.82 TP – claims \(b_2\) 4 \(\hat b_4\) 0.40 \(b_3\) 0.83 TP – claims \(b_3\) -
2. Final counts: TP\(=3\), FP\(=1\), FN\(=0\) (every ground truth was claimed). The per-rank labels TP, FP, TP, TP are exactly the input of Example 18.7 below, which integrates them into AP.
-
Non-Maximum Suppression (NMS)
Table 18.2 contrasts box matching and NMS.
|
NMS |
Box matching \(+\) labeling |
|
|
When |
inference time (every run) |
evaluation time (computing metrics) |
|
Needs ground truth? |
no |
yes |
|
IoU compares |
prediction vs. prediction (\(\hat b_i\) vs. \(\hat b^{*}\)) |
prediction vs. ground truth (\(\hat b_i\) vs. \(b_j\)) |
|
Threshold |
\(\tau _{\text {NMS}}\) |
\(\tau \) |
|
Produces |
the clean predicted-box list |
TP/FP/FN counts |
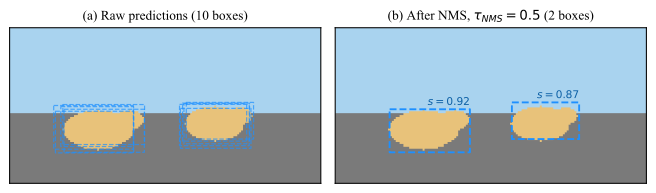
At inference time the detector must return a clean box list rather than a labeled one, so it deletes the duplicates outright. Non-maximum suppression (NMS, used by one-stage detectors such as YOLO, Sec. 18.4.2) does this with the same greedy descending-confidence sweep as the matching rule, except each prediction is compared against the boxes already kept rather than against the ground truth:
-
1. Sort the class-\(c\) predictions by descending confidence scores \(\{s_i\}\), as in Stage 1.
-
2. Pop the highest-scoring box \(\hat b^{*}\) and keep it; remove every remaining prediction \(\hat b_i\) with \(\text {IoU}(\hat b_i,\hat b^{*}) > \tau _{\text {NMS}}\). Predictions with \(\text {IoU}(\hat b_i,\hat b^{*}) \le \tau _{\text {NMS}}\) overlap \(\hat b^{*}\) too little to be duplicates and stay in the pool as candidates for separate objects.
-
3. Repeat on what is left.
The NMS threshold \(\tau _{\text {NMS}}\) (commonly \(0.5\)–\(0.7\)) trades the two failure modes: too low merges genuinely adjacent objects (two pedestrians become one box), too high leaves duplicates. Figure 18.13 illustrates the effect on a two-sheep scene.
Precision–recall curve
With every prediction labeled TP or FP and the FN count fixed (Stage 1), the only remaining freedom is how many predictions to admit. Each predicted box has a confidence \(s\). Sweeping a cut-off \(s_0\) from \(1\) down to \(0\) and admitting only predictions with \(s\ge s_0\) produces a sequence of (precision, recall) pairs:
\(\seteqnumber{0}{}{20}\)\begin{equation} \text {Pr}(s_0) = \frac {\text {TP}(s_0)}{\text {TP}(s_0)+\text {FP}(s_0)} , \qquad \text {Re}(s_0) = \frac {\text {TP}(s_0)}{\text {TP}(s_0)+\text {FN}} . \end{equation}
Plotting Pr vs. Re gives the precision–recall curve at IoU threshold \(\tau \).
Average precision
A whole curve is awkward to compare across models, so Stage 3 reduces it to a single scalar. Average Precision (AP) at IoU threshold \(\tau \) is the area under the (interpolated) precision–recall curve,
\(\seteqnumber{0}{}{21}\)\begin{equation} \text {AP}_\tau \;=\; \int _0^1 \text {Pr}_{\text {int}}(r)\,\mathrm {d}r , \qquad \text {Pr}_{\text {int}}(r) \;=\; \max _{r'\ge r}\text {Pr}(r') , \label {eq-dlarch-ap} \end{equation}
where the interpolation \(\text {Pr}_{\text {int}}\) replaces precision at recall \(r\) by the highest precision attained at any recall \(r'\ge r\), removing the zig-zag of the raw curve.
Two integration conventions coexist:
-
• 11-point interpolation (Pascal VOC, Sec. 18.1, pre-2010): average \(\text {Pr}_{\text {int}}\) over \(r\in \{0,0.1,\ldots ,1.0\}\).
-
• All-point interpolation (VOC post-2010, COCO, Sec. 18.1): integrate over all distinct recall values.
The two yield slightly different numbers and are not directly comparable.
-
Example 18.7 (AP from a small detection table): Reusing the four predictions from Example 18.6 (three ground-truth boxes; TP, FP, TP, TP at descending scores \(0.95, 0.80, 0.65, 0.40\) at IoU threshold \(\tau =0.5\)):
\[ \begin {array}{c|c|c|c|c} \text {rank} & \text {score} & \text {TP/FP} & \text {cumulative TP} & \text {cumulative FP}\\\hline 1 & 0.95 & \text {TP} & 1 & 0\\ 2 & 0.80 & \text {FP} & 1 & 1\\ 3 & 0.65 & \text {TP} & 2 & 1\\ 4 & 0.40 & \text {TP} & 3 & 1 \end {array} \]
Compute AP using all-point interpolation.
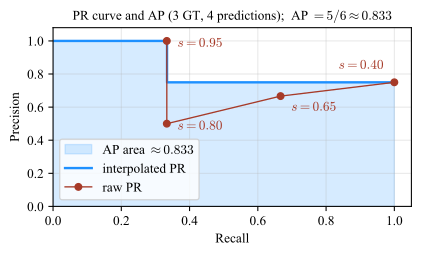
-
-
1. Build the (recall, precision) points
With three ground-truth boxes (\(\text {TP}+\text {FN}=3\)) the recall axis advances by \(1/3\) per TP. For each rank \(k\), using the cumulative TP/FP counts from the table,
\[ r_k = \frac {\text {cum TP}_k}{\text {TP}+\text {FN}}, \qquad p_k = \frac {\text {cum TP}_k}{\text {cum TP}_k + \text {cum FP}_k} . \]
For instance at rank \(k=3\) (score \(s=0.65\)) the table gives \(\text {cum TP}_3=2\) and \(\text {cum FP}_3=1\), so
\[ r_3 = \tfrac {2}{3}, \qquad p_3 = \tfrac {2}{2+1} = \tfrac {2}{3} . \]
Applying the same formulas to all four ranks gives the (recall, precision) points
\[ (1/3,\,1.00),\;(1/3,\,1/2),\;(2/3,\,2/3),\;(1,\,3/4) , \]
shown as red dots in Fig. 18.14, each labelled by its admission score \(s\).
-
2. Interpolate
Interpolated precision is the running maximum of precision over recalls \(r'\ge r\): the largest precision attained is \(1\) at \(r=1/3\) and the maximum at recall \(\ge 2/3\) is \(3/4\) (at \(r=1\), since \(3/4>2/3\)), so
\[ \text {Pr}_{\text {int}}(r) = \begin {cases}1 & 0\le r\le 1/3 ,\\ 3/4 & 1/3 < r\le 1 ,\end {cases} \]
plotted as the blue step in Fig. 18.14.
-
3. Integrate
The integral, i.e. the shaded area in Fig. 18.14, evaluates to
\[ \text {AP} \;=\; \tfrac 13\cdot 1 + \tfrac 23\cdot \tfrac 34 \;=\; \tfrac 13 + \tfrac 12 \;=\; \tfrac {5}{6}\approx 0.83 . \]
-
mAP and COCO-style mAP
Stage 3 produces one AP per class at one IoU threshold; the final stage averages those into the single number reported on a benchmark. Mean Average Precision (mAP) at IoU threshold \(\tau \) is the arithmetic mean of per-class \(\text {AP}_{\tau ,c}\) over the \(C\) classes:
\(\seteqnumber{0}{}{22}\)\begin{equation} \text {mAP}_\tau \;=\; \frac {1}{C}\sum _{c=1}^C \text {AP}_{\tau ,c} , \label {eq-dlarch-map} \end{equation}
where \(\text {AP}_{\tau ,c}\) is computed exactly as in Eq. 18.22 but restricting predictions and ground-truth boxes to class \(c\). Averaging over classes treats every class as equally important regardless of its frequency in the dataset: a model that nails the dominant class but misses every rare class will still score poorly. (To compute one \(\text {AP}_{\tau ,c}\), sweep the per-class predictions sorted by score, accumulate per-class TP/FP/FN, and integrate the resulting per-class PR curve.) COCO introduced a stricter metric that averages over IoU thresholds as well,
\(\seteqnumber{0}{}{23}\)\begin{equation} \text {mAP}_{[.5:.95]} \;=\; \frac {1}{10}\sum _{\tau \in \{0.50,0.55,\ldots ,0.95\}}\text {mAP}_\tau , \label {eq-dlarch-map-coco} \end{equation}
which rewards tight localization: a model that overlaps ground-truth by \(0.5\) scores well at \(\tau =0.5\) but collapses at \(\tau =0.95\).
AP is per-class at one IoU threshold; mAP averages AP over classes; mAP@[.5:.95] also averages over \(10\) IoU thresholds and is the headline number on COCO.
18.4.2 Architecture
All detection networks share the same skeleton: a CNN backbone produces a dense feature map, i.e. a low-resolution \(H'\times W'\times C\) tensor whose \((h,w)\) cell carries a learned \(C\)-dimensional descriptor of the input-image patch that maps to that location; one or more prediction heads turn each feature-map cell into candidate boxes with an objectness (the class-agnostic probability that the box contains any object versus background) and a class distribution; NMS (Sec. 18.4.1) prunes duplicates. The per-(box, class) score \(s\) that the evaluator sees is built from these two: in one-stage detectors typically \(s = \text {objectness}\times \text {class probability}\), in two-stage detectors objectness is the score the first stage uses to keep proposals and \(s\) is the class probability output by the second-stage classifier. Families differ in how many passes it takes to get from the feature map to the final box list.
The two practically relevant families are then:
-
• Two-stage detectors (R-CNN family: Faster R-CNN, Mask R-CNN): stage 1 emits region proposals, stage 2 classifies and refines each.
-
• One-stage detectors (YOLO, SSD, RetinaNet): a single forward pass predicts boxes and classes densely over the feature grid.
A third family, transformer-based detectors (DETR and successors), predicts the whole set of boxes in one forward pass without anchors and without NMS, trading longer training for a simpler inference pipeline; it is increasingly competitive but not yet the practitioner default.
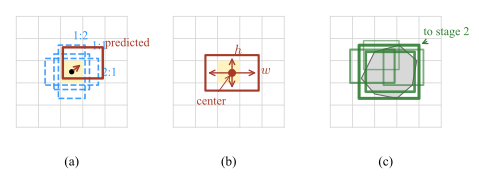
Three detection-specific terms used below (see Fig. 18.15):
-
• Anchor box: a fixed reference rectangle of preset size and aspect ratio, tiled at every feature-map location. The network predicts an offset and a score for each anchor instead of regressing a box from scratch.
-
• Anchor-free head: predicts box center and size \((w,h)\) directly per feature-map cell, with no reference rectangles.
-
• Region proposal: a candidate box with an objectness score but no class yet, emitted by a first stage and fed to a second stage that classifies and refines it.
R-CNN family The modern reference is Faster R-CNN: the backbone produces a feature map once per image; a small sub-network slides over that feature map and emits a fixed pool of anchor-based region proposals with objectness scores; the top-scoring proposals are passed to a second-stage head that outputs a class label and a refined box per proposal. Mask R-CNN adds a parallel head that produces a binary mask per proposal, making the same network usable for instance segmentation (Sec. 18.3). Practical profile: highest accuracy on COCO-style benchmarks, slowest per image, the default when latency is not the bottleneck or when masks or keypoints are also required.
YOLO YOLO (“You Only Look Once”) treats detection as a single dense regression problem. A CNN backbone reduces the input to a coarse feature grid (e.g. \(13\times 13\)); each grid cell predicts a small fixed number of candidate boxes together with an objectness score and a class distribution, all in one forward pass. Low-confidence boxes are discarded and overlapping survivors are pruned per class by NMS (Sec. 18.4.1). Modern variants predict at multiple feature-map resolutions so that small, medium and large objects share the same backbone, and recent open-source releases (Ultralytics YOLOv8/v11) ship anchor-free heads and one-line fine-tuning from COCO weights. Practical profile: real-time on commodity GPUs and edge devices, the practitioner default for deployment, accuracy now close to two-stage on modern variants.
Summary
Architecture choice in one line:
-
• Real-time or edge deployment \(\to \) one-stage (YOLO).
-
• Maximum accuracy, or masks/keypoints also needed \(\to \) two-stage (Mask R-CNN).
-
• Simpler pipeline, no NMS tuning, willing to train longer \(\to \) transformer (DETR).
18.4.3 Notes
Hyperparameters
Architecture-specific hyperparameters are to be tuned (out of scope in this chapter), e.g.: for anchor-based detectors, the number, scales and aspect ratios of the anchor presets; for two-stage detectors, the number of proposals kept after stage 1; for one-stage detectors, the input resolution and the number of feature-map scales.
Reporting performance
-
• Reporting a single IoU threshold (mAP@.5) when comparing to COCO-era methods. Always include mAP@[.5:.95] alongside mAP@.5.
-
• Mixing 11-point and all-point AP across papers and quoting the numbers as comparable. They are not.
Object size influence
Small objects are punished by IoU: a \(5\times 5\) ground-truth box with a one-pixel boundary error already loses \(\sim 36\%\) of IoU. Reporting \(\text {AP}_{\text {small}}\), \(\text {AP}_{\text {medium}}\), \(\text {AP}_{\text {large}}\) separately (COCO convention) is informative whenever object size varies across the dataset.
Further Reading
Convolutional Neural Networks (Course 4 of the Deep Learning Specialization), especially C4W3 (object detection)
-
• Segment Anything and Segment Anything Model by Meta AI Demos (accessed 25-May-2026)
-
• Segment Anything by Hugging Face (accessed 25-May-2026)
-
• WPI Demo
-
• Web AI Demo of the library that allows you to run modern deep learning models directly in your web browser (accessed 25-May-2026)
-
• Conversational image segmentation with Gemini 2.5 by Google (accessed 25-May-2026)